Wednesday, July 6, 2011

A Head Fake Keeps The Bull Alive

Hi there, and welcome back to CRI's S&P 500 blog.


Just when you least expect it....kaboom....a rally!
We here at the Canadian Rational Investor have been doing this so long that we could almost feel a rally coming as we headed into the pre-holiday trading period. The small failure at 130 and the subsequent bullish moment divergence on the 60 min chart led us to believe that a rally was imminent and sure enough, on almost no volume, they were able to bring the market back close to 6%. What is interesting is that we are just now back at the original top put in on the weekly charts with the outside downside reversal mentioned in previous posts.

So lets take a look at things from our trader/investor perspective.

Traders: Well, if you didn't take advantage of the 'dead-cat-bounce' then you really shouldn't consider yourself a trader! Daily charts were heavily oversold the put/call ratio and the short term trading index were at lofty highs and in very typical trader fashion, they were able to take the market up into the July 4th long weekend on very little volume. Traders should have been all over the trade on a move back above 130 (128.32 to be precise). I had someone ask me today about new long positions and I suggested that the risks now are almost 50/50 from here - the easy trade is gone....

Investors: If it is one thing I have come to rely upon it is the old time tested trending indicator (that being the relationship between the 13 EMA and the 30 SMA on the weekly charts) and it has proven its worth again. Regular readers will recall in our last post how we were getting worried that indeed the market may be rolling over. I stated, "...On the failure last week, the 13 EMA is just a fraction above the 30 SMA and unless there is some sort of explosive rally coming, that relationship will turn negative for the first time in six months." Well, the explosive rally did come and because of the rally, the moving average relationship is still bullish. Important here is the 'kiss' effect - what I mean by this is that whenever moving averages come together and 'kiss' but do not cross, we get an important pivot. Since the initial move lower was 'V' shaped (An inverted 'V' really) and we all know markets like to make 'M''s when they top, we didn't have alot of confidence that the market had indeed topped. Now that a rally has come, the market has found an important low and we know that if that low fails again, we are definitely heading lower. With all that said, investors can now, quite comfortably, move collective stops to just under the most recent sell-off's lows (in this case the low is 125.70...so something like 125.67) knowing that if the market breaks these levels an 'M' top will have been registered and that (in all likelihood) the moving average relationship will cross back into a bearish stance. 

So in summary then, we got the dead-cat-bounce were looking for and an important new low has been registered. Our cycle analysis suggests this market still wants to go higher into the late summer so traders ought to be taking advantage of low volume spikes. Investors ought to still be long with the notion that a failure of the recent lows may be the big 'sell' signal we have been looking for. While the market is ok in the short term, one has to appreciate the building case for a modest correction to bring us back down into the 'support zone' highlighted on the chart above.


That's all for this week,
Brian Beamish FCSI
The Canadian Rational Investor
the_rational_investor@yahoo.com
the-rational-investor.com

Sunday, June 26, 2011

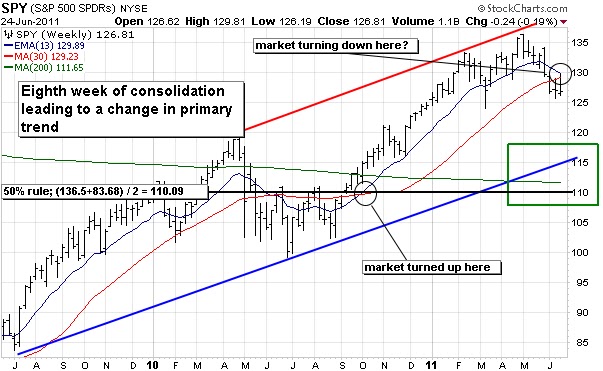
Eighth week of consolidation leading to a change in primary trend

Hi there, and welcome back to CRI's S&P 500 blog.


For the past eight weeks we have seen the broader US stock market flounder as it comes to grips with the notion that the US Fed will stop flooding the market with cash. The end of QE2 has been met with a literal stop to any and all new purchasers. Last week's blog entry suggested that the market needed to rally a bit to relieve its oversold condition and that the 130 area seemed like a reasonable target. Indeed, as the market headed into the 2 day FOMC meeting (held last Monday to Wednesday) the 'dead-cat bounce' was fully underway and the market did rally into the suggested target zone. Upon the completion of the meeting (and more importantly the announcement of no new QE3 program) the market topped and then failed miserably into the weekend. So what can both traders and investors take away from this past week's price action?
Traders: Since the 'outside-downside' bearish price pattern registered just three weeks ago, traders have been well advised to be flat and watching from the sidelines. Considering the steep sell-off, I still wouldn't be surprised to see a bit more of a rally before one considers going short aggressively. So, as was the case last week, traders ought to be sitting in cash and watching.

Investors: Here we have a potential event that warrants attention. Since last fall's breakout, investors have been well advised to be long (and stay long). The market slowly worked it's way higher as our time tested 'investor signal' (that being the relationship between the 13 EMA and the 30 SMA) had been comfortably bullish. That may be about to change. On the failure last week, the 13 EMA is just a fraction above the 30 SMA and unless there is some sort of explosive rally coming, that relationship will turn negative for the first time in six months. While I am reticent of jumping out too soon, investors would be well advised to pay close attention to this important relationship and more importantly - for a change.

So if the market continues to consolidate, where might we be heading? As the chart above suggests, there is a lot of evidence to support the notion that the market would like to work its way back down into the 110-115 area. Three technical indicators suggest such an event. 1. The 200 SMA is sitting at 111.65. 2. A 50% rule of the entire bull move (from June 2009 to now) suggests prices want to come back to 110.09. 3. The bottom of the very well defined price channel sits in and around the 115 area. 

Ironically, this target zone  is within a fraction of where it broke out last fall, suggesting that the last six months of rally was for nothing. Additionally, any new QE3 program will only be initiated when the market is looking to be heading into free-fall. I might suggest that these two events will coincide - When the market makes its final push into the target zone - macro-economic will force QE3 and the market will stabilize once again....but that is just a theory for now.

That's all for this week,
Brian Beamish FCSI
The Canadian Rational Investor
the_rational_investor@yahoo.com
the-rational-investor.com

Tuesday, June 21, 2011

Seasonal top leads to healthy correction

Hi there, and welcome back to CRI's S&P 500 blog.


As has been the case for many weeks now, we here at CRI have been looking for some of the steam to come out of the market given the typical seasonal pressures that are at work through the end of the spring. The old cliche, 'Sell in May and walk away' has indeed played itself out - and as a result prices have fallen appreciably. The question now is, is this a normal healthy correction within a bull market or is this the beginning of a new bear cycle. 

As was noted last week, I am more than happy with the notion that this latest bearish price action is nothing more than a normal (healthy) correction within the framework of a rather large bull cycle. Considering  the yield curve is still quite healthy (where long term interest rates are still higher than short term interest rates) I don't see a reasonable case to be made of a pending recession. Consider too that the current bull cycle itself seems to be pointing towards a climactic peak some time in late August/early September (as a trader ) I am not ready to short the market but rather to sit patiently on the sidelines and wait for a new long entry. Investors on the other hand, should be quite happy to sit in their long positions and patiently wait out this latest bearish action. Of course, should our time tested 'investor' signal (that being the relationship between the 13 EMA and the 30 SMA) turn negative, that stance will have to change. It is still very positive so again, investors ought to just sit on the long side and enjoy the nice spring weather.

So what should one expect over the coming week then? I myself wouldn't be surprised to see a nice 50% retracement of this recent sell-off. We started the latest push lower about a month ago with a nasty outside-downside bearish engulfing pattern where the high was 134.26 and we worked our way down to 125.7. With these numbers in mind, I am looking for a bounce back into the 130 area [50 rule; (134.26+125.7)/2 = 129.98]. The peak from 6/14 was 129.77 and I bet the pro's are going to go fishing for the stops in and around that area. Also too, keep in mind we are (as of today's writing) into the 2 day FOMC meeting and traders love to play with the market into such events. Once the announcement of their decision is made - the market ought to resume its 'normal' trend.

Considering there is much speculation about if there will be a QE3, one ought to expect this debate to drive the trade until they are done their meeting. My hunch is, they will only start QE3 with the proverbial 'sh*t hits the fan' - as long as the market isn't tanking - there will be no QE3. Once the market starts to tank - then they will consider action. Adding in our cycle analysis (suggesting there ought to be a pivot at the end of the summer) my hunch is that debate will not begin in earnest until the fall - no pun intended. Considering too that current medium term market support is still a good 10% lower than where we are now (1 year 50% level, 200 SMA, and trend channel support) a climactic push into that correction zone (highlighted by the box on the chart above) will probably coincide with the announcement of QE3 which will coincide with that bull cycle end. But that target is still off in the distance and as is always the case - we will cross that bridge when we come to it.

That's all for this week,
Brian Beamish FCSI
The Canadian Rational Investor
the_rational_investor@yahoo.com
the-rational-investor.com

Saturday, June 11, 2011

Natural progression of stock market cycles

Hi there, and welcome back to CRI's S&P 500 blog.


For the sake of breaking the repeated message for the last while - when in May, blah blah blah, I thought we ought to take a good look at where we have come from and where we may go if indeed we are entering a corrective period. 

First off, lets start by appreciating how symmetrical the market is. If one starts with the massive upward channel (double black lines) and then uses the end of July, 2010 as a pivot, one sees how we have gone through a 26 month cycle (double diagonal red line) from trough to peak. The 26 month cycle comes to an end in September, 2011 and suggests we will have to go through a new 26 month cycle after that. Regardless of weather the new cycle is up or down is not relevant here, just the appreciation for the fact that we are at an end of a cycle - not the beginning.

Alright, now back to the present...

After yet another failed rally attempt, we are now breaking support of the most recent bullish uptrend. Last week's bearish engulfing pattern has led to further weakness. The most recent 'stop' point (129.51) for traders has been broken and traders should now be very comfortably on the sidelines. Investors can still take comfort in the fact that the 13 EMA is still well above the 30 SMA suggesting we are still in a correction of a bull market. Should that relationship change, investors will be given the exit signal and we will officially end the bull market.

Now if we do continue to 'correct', where might we go? The most important number that jumps out at me is the good old 50% rule. A one year 50% rule suggests we ought to look for prices to pull back into the 118.40 (point 2.) area and a two year 50% rule suggest we ought to look for prices to pull back into the 110.60 (point 3.) area. This bracket (118 to 110) ought then to be a realistic zone for correction. Further supporting this argument is the fact that both the 200 SMA and the bottom of the massive channel (double black line)  are currently comfortably in this zone too.

Since our last 'investor' buy signal (110 area) the market has advanced more than 16% so all those that did do the trade should still feel very good. Should the market roll over here (and we do get an 'investor' sell signal) there shouldn't be too many complaints. But we will cross that bridge when we come to it.

That's all for this week,
Brian Beamish FCSI
The Canadian Rational Investor
the_rational_investor@yahoo.com
the-rational-investor.com

Sunday, June 5, 2011

Traders getting nervous, Investors still comfortably long

Hi there, and welcome back to CRI's S&P 500 blog.


The time tested cliche, 'Sell in May and walk away' has once again put a seasonal top in the broader US equity market (as measured by the S&P 500 index depository receipts - SPY). This top comes after an impressive 30% rally since the US mid-term congressional elections just last November. While the market has yet to break down in earnest, traders should be nervous. The rally has failed twice at the top of the trend channel and is now in the process of testing key support at or near 129.51. Should that level fail, our next support level comes in near the 125 area.

This latest bearish move in equity prices (an outside downside key reversal no less) has came on the heals of a very poor May US Employment report issued last week. It suggested far fewer people found work in the US than had been expected and points out how this 'recovery' has not been broad based. Since we know that the yield curve is still rather healthy (with long term interest rates still well above short term rates) one doesn't have to worry about the prospects of a recession any time soon. So then what kind of correction are we talking about here? A natural 50% correction (of the bull ran that started last fall) seems most likely to be expected. Indeed, a 50% correction of this bull run would bring prices back into the 118.5 area and would clean up a lot of the excesses built into the market over the past seven months.

Traders will be watching the important low from the week of April 18th at 129.51. Should this level be broken one ought to expect a move back down into the 125 area and then should that area fail an ultimate move down into the 115 area.

Investors ought to just sit tight for the time being as our time tested 'investor signal' (that being the relationship between the 13 EMA and the 30 SMA) is still very much in the bullish camp.

In summary then, at worst one ought to expect a quick violent move back down into the 115 area and at best we will slowly move down/sideways into the 120 area. A 50% correction of the entire bull run brings prices back into the 118 area and I wouldn't be surprised if that number is hit over the coming weeks/months. Either way, it would appear we are starting to clean up the excessive bullishness of the past seven month post mid-term US congressional election rally.

That's all for this week,
Brian Beamish FCSI
The Canadian Rational Investor
the_rational_investor@yahoo.com
the-rational-investor.com

Sunday, May 29, 2011

The Bull Continues But Is Struggling

Hi there, and welcome back to CRI's S&P 500 blog.


Not to sound like a broken record, but the seasonal peak we traders look for into the spring seems to be establishing itself once again. The cliche, Sell in May and Walk Away, isn't a cliche because it doesn't happen. Looking at the market from a one year perspective, we see that prices have been basically trapped within a rather steep upward pointing channel where only three times in the past year has price moved out of the channel.

The past week's failure through the very steep price channel (that was established earlier this spring) leads one to believe that the bottom of the one year trend channel is going to be tested in earnest over the coming weeks/months. Investors can take comfort in the simple fact that our time tested trend indicator (that being the relationship between the 13 EMA and the 30 SMA) is still very bullish. Traders on the other hand will be watching the 129.51 level as that is short term support. If broken, traders would have no choice but to move to the sidelines. For now we must remain relatively bullish but should price continue to deteriorate both investors and traders may be forced to change their respective stances.

Given the poor fundamental backdrop in North America (an already  high unemployment rate  coupled with historically low short term interest rates) and the rising tensions over European debt problems (and their associated austerity measures) maybe equity prices have gotten a little ahead of themselves. While we have not broken down yet, if we do indeed roll-over, serious support is a long way down from here (200 SMA currently near 112). Lets hope that doesn't happen (and that we basically trade sideways for a period) but if we do break in earnest, be prepaired for a potentially dramatic pull-back in price.


That's all for this week,
Brian Beamish FCSI
The Canadian Rational Investor
the_rational_investor@yahoo.com
the-rational-investor.com

Saturday, May 21, 2011

Looking tired into seasonal peak

Hi there, and welcome back to CRI's S&P 500 blog.


Further to recent posts, a typical seasonal top (sell in may and walk away)  seems to be establishing itself as move into the 'May 24', weekend. With what is known as the official kick-off to the summer driving season, many commodity wholesalers have stocked up on their supplies and their demand (seen for these products over the past few months) shall wane going forward. Couple this lack of demand with the idea that the Fed intends to end its' QE2 program in June '11 suggests we might head into a bit of a demand vacuum going forward. Price could be vulnerable here so please be careful.

As suggested by the chart above, real technical support for the broader US stock market now sits substantially lower than where we are now. Currently the 200 SMA for the SPY sits near 112 and the bottom of the massive monthly uptrend channel sits near 115. Interestingly, both of these points are very close to where the market turned higher last fall. Does this mean that the rally from last fall my totally evaporate? It is a definite possibility but we will cross that bridge when we come to it. For now, the market is at worst 'going sideways'. And since our time tested trending indicator (that being the relationship between the 13 EMA and the 30 SMA) is still bullish we must continue to look for higher prices down the road. Should that relationship change, then too our stance will change. 

The question here is one of risk. Currently the upside target for the tight bull-flag formation registered just a few weeks ago is 138.77, while real support is near 112. Since we finished this last week at 133.61 we can conclude that owners of SPY have a little more than 5 points of potential profits with 21 points of risk. Is a 5/21 risk-reward ratio really worth it? Maybe not. Either the economic situation or earnings have to drastically improve to justify these high prices and I personally don't think either will.

That's all for this week,
Brian Beamish FCSI
The Canadian Rational Investor
the_rational_investor@yahoo.com
the-rational-investor.com