Sunday, December 30, 2012

Fiscal Cliff setup is in place & ready to go

Hi there, and welcome back to CRI's S&P 500 blog. Our peak at the SPY (S&P 500 depository trust units):
  The final week of 2012 brings us all to a very interesting point in the market. Due to political gridlock from Washington it would seem we here in North America are going to jump off the 'fiscal cliff' in unison come January 1st, 2013. Considering this was a term coined by a US government official, there really isn't any telling exactly what is going to happen to the North American economy once the calendar turns, but it is very interesting to watch the collective psychology of 'investors' as they hum-and-haw over the possibilities. Fundamentally, one could make the argument that the US government's balance sheet has long been due for some cleaning up and the broader market drivers (interest rates & corporate profits) are actually very supportive of higher not lower stock prices. Additionally, markets love split democratically elected governments. The more gridlock, the less that can be done to tinker with the market's underlying fundamentals. The 64k question really seems, do we get caught up in the short term 'panic' or do we approach our market participation from a Rational perspective and not get caught up in the short term hoop-la.

Rational overview:
Fundamentals: As pointed out above, the 'E' in current P/E ratios is still rather healthy. Additionally, the US Federal Reserve Board's current low short term interest rate policy is supportive of both yield curve driven earnings and the general cost of doing business going forward. Put it all together and one can make the arguement that the underlying fundamentals for corporate profits look ok going forward. Lastly, investor sentiment is currently rather poor. Last summer investors got a little ahead of themselves (with the likes of AAPL etc.) but now much of that euphoria is gone. Sanguine investors don't make the backdrop for stock market crashes. - corrections, maybe - crashes, no.

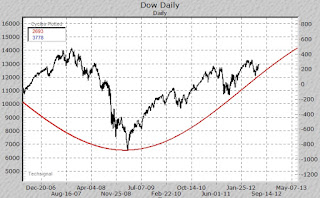
Technical: This market is a bit overdue for some sort of corrective price action. We have basically been heading straight up for more than a year now and find ourselves quite far away from serious support (200 period simple moving average - our 4 year business cycle - is currently more than 17% lower than current prices). Additionally, there are noticeable gaps to the downside (in that 200sma area) that ought to be filled in at some point down the road. Even a move back to our time tested '50%' level would imply a better than 10% correction from where we are now. Finally, as hopefully you can see from the chart above, the market is currently working a 'bullish wedge' pattern (Notice the converging Red and Blue trend lines). Unfortunately, these types of patterns often resolve themselves bearishly.

Seasonal: The seasonal underlying drivers were supportive of price moving higher into the end of the year both from a regular annual event driven basis (Santa Clause rally) and from the US Presidential election year cycle forces. Unfortunately, that bullish window is closing and typically the period from the first week of January through the middle of February has been met with selling pressure since the beginning of the current 'fear' cycle back in 2001. This seasonal  tendency shall continue for another five years (into anticipated peak Q3'17) and there is no reason to suspect otherwise this go round. Once through the middle of February we ought to see our regular seasonal pressures drive prices higher into the spring but that is at least a month and a half away.
 
Rational Summary: Put it all together at it would seem to me we are due for some price consolidation. But that does not mean we have broken down. Indeed, at worst, one can argue we are stuck in a very wide trading range at the present (146.29 to 133.75). Fundamentals would still support higher prices over the medium term but maybe a period of technical 'cleaning-up' is in order. With that said, one should determine what kind of market participant you are and then act accordingly.

Trader Stance: Traders have been given a nice shorting opportunity heading into the end of the calendar year with the rally into the daily OTE Short SS (70.5% retracement of previous sell-off) at 142.59. With stops just above the old highs 146.30 area (4 points of risk) and targets near the recent lows 133.75 (9 points of reward) this represented an attractive 2:1 reward to risk ratio. Aggressive traders could add to their short positions on the close below the 13ema (with stops on the added position just above last week's high). But given the fact that our 'fast' indicator (13ema) is still well above our 'slow' indicator (30sma) I don't think we are quite ready to break down in earnest just yet.
 
Investors Stance: While this commentary may sound boring and very repetitive, this camp has been well advised to be long and stay long for more than a year now. Those that took last year's investor 'buy' signal are well into double digits returns (if not more) considering dividends. As long as the 13ema remains above the 30sma I see no reason to touch long positions at the moment. Be long and stay long as we collectively climb the 'wall of worry'. 
 
That's all for this post,
Brian Beamish FCSI
The Canadian Rational Investor

Sunday, December 16, 2012

Santa's in charge - for now

Hi there, and welcome back to CRI's S&P 500 blog. Our peak at the SPY (S&P 500 depository trust units):
While surfing the web I came across an interesting blog entry from Avondale Asset Management on the Santa Claus rally and its effect on stock prices in general through the end of year holiday season:


So here we are at the end of another year. 2012 is almost behind us but doesn't seem to want to go out without a bang. As was posted in our last entry, stocks themselves looked to be 'climbing-the-wall-of-worry' heading into and now out of the 2012, US Presidential elections. Historically, markets often do quite well coming out of October and into the end of the year and because of the US Presidential cycle's influence it seemed as though this year would be very much like others of the same ilk. Indeed, prices have slowly chopped their way higher over the past month or two and there still is no solid reason to abandon what has turned out for investors, to be a very fine trade. Regular readers will remember that our 'investor camp' was given the 'buy' signal (based on our time tested weekly 13ema/30sma cross over system) a little over a year ago. The capital gain on the trade alone is more than 18% and if you included dividends it is well over 20%. As long as that moving average relationship remains bullish then we are best to just sit back and leave the trade alone. Having said all that, one must respect the 'nose-bleedy' territory the market is currently within. As the chart above illustrates, we recently bumped up against a resistance line (red dotted line) and failed. Should we reverse and start closing below the support lines (blue dotted lines) we may see the end of this current rally. Given that backdrop, it should also be noted, price are indeed currently over-extended. A 50% retracement of the last year's rally represents almost a 15% correction in price from current levels. Notice too how far away our 200 week sma (or our 4 year business cycle moving average) is. Real support in price ironically is back around where our 'investor camp' last bought in. Should a correction in earnest occur through the early part of 2013 (fiscal cliff worries et all) we may see our 'investors' get a chance to buy their investments back at the prices they paid a little over a year ago.  


Trader Stance: Traders were given a shorting opportunity on the double top and subsequent break of the weekly 13 ema about eight weeks ago. That pattern was quickly reversed when prices rejected the weekly 30 sma touch and we have basically rallied since then. Traders may consider OTE Short SS entries at or near a 70.5% retracement of the recent trading range [0.705(147.32-134.7)+134.7=143.59]. Stops would be at least 10 ticks above those highs at 147.32 and targets would have to be at least two times risk. Should one take the OTE short, traders would be well advised to take partial profits on a test of recent support at or near 134.70.
Investors Stance: This camp has been well advised to be long and stay long for more than a year now. Those that took last year's investor 'buy' signal are well into double digits returns (if not more) considering dividends. As long as the 13ema remains above the 30sma I see no reason to touch long positions at the moment. Be long and stay long as we collectively climb the 'wall of worry'.

That's all for this post,
Brian Beamish FCSI
The Canadian Rational Investor

Sunday, October 21, 2012

Climbing the wall of worry

Hi there, and welcome back to CRI's S&P 500 blog.
Our regular weekly peak at the SPY (S&P 500 depository trust units):
 Special treat from the Foundation for the Study of Cycles (Dow cycle projections):

With my personal activity focused on the very difficult notion of day trading the Crude Oil markets I must admit I have let some of my other free blog services slide of late. Having said that, the best part of using a very slow timing signal (like our weekly 13ema/30sma cross system) is that once a trend is established, it can often go on for far longer than any of us would expect. Indeed that does seem to be the case with the US stock market in general and the S&P 500 stock index in particular. 

The current price action seen in stocks globally reminds me of the old cliche of 'climbing the proverbial wall of worry' in that the average investor panicked into the financial crisis and dumped their long positions. They will continue to be bearish as price moves back up and claim that 'fundamentals don't justify prices rising'. Ironically, it is at the point where the average investor capitulates (and buys back their positions) that we as 'smart traders' need to start to get worried. As long as I turn on CNBC or Bloomberg TV or any or the other major media outlets and they are talking bearishly then I am more than happy to stay long. Once they start to get bullish, then I will start to get concerned.
  
Our last trade (investor 'buy') signal was generated way back in the fall of 2011 (at or near the 120 level on SPY) when the weekly 13ema crossed back above the weekly 30sma. The market has rallied more than 20 points from that level and investors are still cautioned to remain long as that moving average relationship is still pointing rather bullishly. Considering dividends, this one trade about a year ago has turned out to be very profitable.

Given the dramatic rise in stock valuations over the past year investors should not be surprised if we do indeed have to go through a short term correctionary period in the not too distant future. Our other time tested trading tool (the 50% rule) suggests this market at any given point in time could be subject to a 10% correction. As well, I do believe there is significant support at or near the original breakout point (125 area) and that is indeed about 10% lower than where we currently are.  I say correction because there is little evidence to support the notion that this bull is finished.

Fundamentally, corporate earnings (while not gangbusters) are 'ok'. Additionally, the yield curve is currently in a normal or healthy state (ie short term interest rates are lower than long term interest rates). Seasonally, we are entering an 'ok' time of year for stocks too (once out of October markets very rarely crash until into the new year) and finally, we have a pending election to deal with. Put all this together and it is my assumption that prices may 'correct' over the coming weeks but that correction is a buying opportunity.

As an added bonus this post, I have included a chart from the good people at the Foundation for the Study of Cycles (webiste). The chart is an actual price action chart of the Dow overlaid against their current cycle projections. While the chart in itself isn't enough to base an investment decisions, it is interesting how it seems to correlate with the notion that we ought to see higher not lower stock prices over the coming weeks/months.

Trader Stance: With the recent daily/4hour double top coming in on SPY traders ought to be looking closely at the weekly 13ema for short term direction. If the market fails then a short trade back to the 30sma seems likely and if that push has any enthusiasm we may see the daily 50% level hit. Traders ought to be focused on OTE ss entries with tight stops just above resistance.

Investors Stance: This camp has been well advised to be long and stay long for almost a year now. Those that took last year's investor 'buy' signal are well into double digets returns (if not more) considering dividends. As long as the 13ema remains above the 30sma I see no reason to touch long positions at the moment. Be long and stay long as we collectively climb the 'wall of worry'.

That's all for this week,
Brian Beamish FCSI
The Canadian Rational Investor


Saturday, August 25, 2012

Late summer rally into resistance

Hi there, and welcome back to CRI's S&P 500 blog.


As has been the case now for more than a couple months, the US stock market (as measured by the S&P 500 stock index) has been moving higher after a rather healthy spring correction. So much so that it has broken the spring highs and looks like it wants to move higher in the short term. The trading sessions around big holiday pivots (NewYears, Easter, July 4th, and Labor Day) often see some wild gyrations. This year's Labor Day transition period may see very much the same. The market is moving higher, but we are approaching a significant resistance zone. 

So what may take the wind out of our proverbial sails? Well there are several 'normal' seasonal drivers this time of year as well as some more pressing short term market issues that need to be dealt with. Firstly, the commodities markets are subject to their seasonal issues (the end of the driving season is near and that means a transition of focus away from natural gas and unleaded and back to heating oil for the energy market; construction season is winding down so that means copper and metal markets need to reprice demand; and fall harvest is fast approaching and that means a glut of agricultural supply ought to hit the market in the coming months). Secondly, from a supply/demand perspective of equity (ie stock ownership) the sessions following the Labor day weekend are when many market professionals come back from their summer holiday's and look to take advantage of higher prices to lock in some profits. They will often dump their under performers and look to acquire new names into the anticipated fall dip. And lastly, from a more shorter term perspective, there are several fundamental drivers (specifically from Europe and votes on bailouts of the PIGS nations) that will take place through the end of September. These events ought to inject some uncertainty and fear into the market. So, put it all together and one ought to temper their bullish enthusiasm through the next few months. We have enjoyed a nice rally in many markets through the first eight months of 2012 - now is not the time to get too greedy when it comes to capital gains.

If one were to look at the chart above, it should be fairly clear to see the current support and resistance zones the equity market is working with. We are now brushing up against the underside of a rather significant trendline that ought to keep a lid on price for at least the short term. That trendline appears to come in at or near the 145 area so there is still a little wiggle room higher should we get some sort of burst higher in the coming sessions (holiday pivot volatility). Conversely, we are more than 10% higher than any real support as the current '50% rule' level is more than 15 points lower than where we closed Friday. Considering too the historic nature of September (it is often the worst performing month in the calendar year), the converging trendlines and the noticible gaps and we have a building list of reasons why price ought to correct. I will be expecting that correction to test the spring lows (126.48 on SPY) and for the market to ultimately trade back to the 50% level (124 area). I say 'correct' and not 'crash' because 1. The yield curve is still very healthy and the US Fed has just recently suggested it will add liquidity (not take it away). 2. Corporate earnings are still very robust. 3. November is a US presidential election and very rarely do markets break in earnest ahead of such events. 

Once past November, all bets are off as the looming 'fiscal cliff' shall dominate trade. Is the market getting ready for that event now by topping out? That could very well be the case but we won't know for sure until we start to actually see some price deterioration. One of the biggest mistakes I see new investors make (and I still make) is to assume something has happened (or is going to happen) before it actually does. As of now, our time tested 'investor signal' (that being the relationship between the weekly 13ema and 30sma) is still positive and has been so since the market turned up late last year. One would have been remiss to step in front of that indicator and as long as it remains positive 'investors' ought to sit tight and hold on to their long positions.

Trader stance: this camp ought to be long from the significant breakout through 137.80. Stops on that trade still ought to remain below the 132.50 area as no new support zone has been established since the breakout. The break above the spring highs (141.48) does imply a massive bullish ab=cd formation; so until the market does actually breakdown, one still ought to be looking for higher, not lower prices...

Investor stance: As outlined above, 'Investors' were given the signal to get back into stocks almost a year ago (when the 13ema crossed back above the 30sma) at or near the 120 area. They ought to be sitting on the better part of a 16% capital gain as well as dividends paid along the way. Does it seem realistic for the market to give a bit of that back? Considering the historic average return for stocks is 11% (capital gains plus dividends) and I think one could argue that yes it does. Having said that, our time tested indicator is still bullish so one ought to sit tight and enjoy the nice late summer warm weather - just be ready to act, should the market tell us to do so. 

That's all for this week,
Brian Beamish FCSI
The Canadian Rational Investor

Monday, August 6, 2012

Summer rally back into resistance

Hi there, and welcome back to CRI's S&P 500 blog.


It has been a few months since I have posted an SPY blog update. I have been so busy trading Crude Oil, I just haven't had the time to address this market in earnest. Additionally, the seasonal top has played itself out rather 'normally' so I didn't feel there was anything of note to mention. 

So without further delay, here is CRI's latest offering on the S&P 500 stock index (as measured by the S&P 500 depository notes, SPY).

Our last post (May, 2012) suggested the bulls needed to take a break heading into the anticipated seasonal peak of late spring. Indeed, the market did break down in the short term when we reached the upper channel trend line (refer to chart above). The correction itself was less than 50% of the run up which suggests the bull is stronger than price would suggest. Interestingly, through the entire correction process, our time tested 'investor' signal (that being the relationship between the weekly 13ema and the 30sma) did not flash any sell signals. While the moving average relationship is tight, it is still bullish and we would be remiss to step in the front of that. If and when it does turn negative, we shall be prompted to act. It has not, so we ought to sit on our long positions and enjoy the nice summer weather.

Trader Stance: Those wishing to trade the market are faced with a tough trade right at the moment. Over the past few weeks we have rallied right back up into significant resistance (original double top breakdown). Those that are long ought to look for a test of the highs (141.48) but I am not totally convinced we will break those highs. Should we fail at the top of the range here, I will be looking for a test of the summer lows going forward and an ultimate move back to the 50% level and to fill in the rather noticeable gaps left last winter. The market has yet to fail, so for the time being, be long and again....enjoy the nice summer weather.

Investor Stance: Unlike traders, Investors would have been best serviced doing absolutely nothing through the very normal seasonal top coming out of last spring and into early summer. As stated above, as long as our time tested 'investor signal' remains positive we would be best served staying long and (like our traders buddies) enjoy the nice summer weather...

That's all for this week,
Brian Beamish FCSI
The Canadian Rational Investor


Sunday, May 13, 2012

The Bull Needs To Take A Break

Hi there, and welcome back to CRI's S&P 500 blog.
The seasonally positive window for assets in general and equity related ones in particular has begun to close.  As suggested recently, those long the breakout trade from last fall ought to have been stopped out of their long positions when the market broke the 135.76 lows (marked as point A on the chart above). Since our Investor signal (that being the relationship between the weekly 13 EMA and the 30 SMA) is still sitting rather bullishly; I am reluctant to consider the current pull back anything more than a correction within a broader move higher. Should that moving average relationship change (over the coming weeks/months) our collective stance on equity investments will change - but that is not the case at present.

So if I believe price is correcting, were we ought to expect it to move to? Since there are both a 50% retracement target and a rather noticeable gap around the 125 area, that shall be my short term target going forward (point B on chart above). That represents about a 12% correction from the highs and is historically 'normal' given the upcoming seasonal pressures. Should all hell break lose, my secondary downside target will be a test of the entire uptrend (and another significant gap) in and around the 115 area (point C on chart above).

Traders Stance: Either flat and enjoying the nice profits from being long through the seasonally bullish window or if one must, short from the break of 135.76 (with stops just above the recent highs at 141.66). This would represent a six handle risk for a ten handle profit potential and frankly I wouldn't be surprised to see the trades run those stops. One probably ought to try and get/be short from above the 137.5 area expecting them to run it to new highs. A stop above the 142.5 area would represent a $5 risk for a $12.50+ reward (or about 1:2.5). The market may not rally back up to the 140 area and I might miss the trade but I like the risk reward ratio better by being a little patient if I must be short - which really I am not leaning to be.

Investors Stance: As investors we were given the 'time to get back in' signal more than five months ago. Even with the recent pullback that represents a  7.5% capital gain. With dividends, this represents a very acceptable return. While no Investor sell signal is close, based on the chart analysis above, one ought to expect to see some more softness in the coming weeks and that capital return may 'come-in' a bit more. Having said that, that softness isn't necessarily a bad thing. Indeed, what we may find is that the next significant low represents a place where we as investors can move our collective stops and 'lock-in' profits over the longer term. Markets just can't keep going up indefinitely. Like stair-cases, there is a rise then a pause, then a rise, then a pause. For now, our 'Investor signal' is still bullish and therefore we must consider this a 'pause' and nothing more.


That's all for this week,
Brian Beamish FCSI
The Canadian Rational Investor

Saturday, April 28, 2012

The bulls remain in control

Hi there, and welcome back to CRI's S&P 500 blog.
Through this seasonally good time of year for the economy in general and equity investments in particular, it is not surprising to see the SPY move up to our previously stated upside objectives. While the weekly bull flag target was hit rather briskly, the market came within a whisker of the monthly target before backing off here recently. The recent pull back probably represents a good place for traders to move their collective stops to lock in a good portion of the late winter early spring rally. While I am still looking for another burst higher here in the short term, one must appreciate both the seasonal nature of stocks and the sheer distance of this latest bull run. Interestingly, a 50% retracement of this bull run would bring us right back to about where the original buy level came in - but we will leave that analysis for when the market does indeed breakdown.

Trader Stance: As stated above, traders ought to move their stops on the remaining half of their long position [exiting first half upon hitting the first upside target (136.71)] to just under the recent lows (135.76) and exit should the market break below this important pivot area.  

Investors Stance: Investors have been long since last fall (when our time tested indicator - that being the relationship between the weekly 13 EMA and the 30 SMA - turned bullish) and there appears to be no reason to change that stance as of this week's close. While price may fluctuate for a while in our current trading range, collect dividends and know you already have a capital gain buffer to absorb any short term pullbacks. As long as our moving average relationship remains positive, stocks are an ok place to be.


That's all for this week,
Brian Beamish FCSI
The Canadian Rational Investor

Sunday, February 19, 2012

The bulls are back in control

Hi there, and welcome back to CRI's S&P 500 blog.


The more I do this the more I am reminded that more than 80% of people who 'play' the market lose money. Only those that can remove emotion from trading can truly prosper. Case in point - those that sold (or even went short) into the panic of last fall are feeling the pain today. Indeed, if one were to believe the media, there is plenty to bring the markets down, and yet they rise. I myself was incredibly reluctant to believe the latest 'Investor' buy signal and yet here we are - moving higher. Having said that, with this past week's breakout through last spring's highs on the SPY we are registering yet another massive buy signal. As the saying goes, higher highs and higher lows define a bull market. Seasonally too, we can and ought to see the markets move higher. The current seasonal window closes near May which is several months away. Make no mistake, there are plenty of reasons to see a quick 1-2 percent drop. But unlike the last five months of 2011, pull backs ought to be considered as buying opportunities.

The current bull charge began some eight weeks ago. Traders and investors got the signal to 'get back in' in unison (which is rather bullish in itself). The signal was both a crossing of the 13 EMA back above the 30 SMA (Investor signal) and a double bottom price pattern (trader signal). 

Traders Stance: As suggested above, one ought to be long now (from about 126.46) and that trade has been on now for more than seven weeks. Stops ought to be just below the recent significant lows and the 13 EMA (just under 130 area). The market is still pointing higher so I wouldn't be in a big hurry to take the position off; ultimate target is 143 area (weekly bull flag).

Investors Stance: Investors got the signal to get back into stocks at just about the same time as traders (in and around the 126.50 area). This 'investment' is up more than 7% so a period of consolidation ought to be expected at some point in the not too distant future. As the massive bull flag suggests an ultimate upside target of 143 (or a 13.5% capital gain from 126) will be the point when we officially suggest taking profits. That may not happen for many months down the road, but considering the January Barometer's reading, the fact that this is a US Presidential election year, and the fact we are very early in the seasonal trade, it does seem like a realistic target.  

That's all for this week,
Brian Beamish FCSI
The Canadian Rational Investor

Tuesday, January 10, 2012

A resolution to the upside

Hi there, and welcome back to CRI's S&P 500 blog.


After taking some time off to visit with family I am back in the saddle to comment and guide readers through these tumultuous markets. And what greeted me first thing yesterday morning was a surprisingly bullish tone to the market. They often say that January's price action will give you an indication of what to expect for the remainder of the year (known as the January Barometer). With this in mind, I will be closely watching how January plays itself out. Additionally, we are now into the second week of Q1, 2012 so I will be watching how each sector finishes the week for an indication of where international money managers are putting money to work. The more I do this (I'm now comfortably into my 17th year of being a full time student-of-the-market) the more I find it interesting how we move from one market cliche to another. In this case, I am reminded of Don Vialoux's addage..... buy when it snows and sell when it goes.

So Lets review how our two primary camps ought to be positioned:
Traders: Interestingly, both traders and investors got good looking buy signals four weeks ago, each for their own reasons. Traders ought to have bought the steep double bottom formation where the long trigger was the high of 126.46 (from the week of December 5th). This occurred through the end of the week of December 19th. Santa Claus came this year, indeed. Targets on this trade should be in and around the 131.00 area [Bull flag formation: (126.46-115.47)+120.03 = 131.02]. Stops on this trade ought to be just below the recent significant lows of 120.03.
Investors: As indicated above, investors finally got the signal to get back into stocks through the week of December 19th. This signal was generated when the short term moving average (13 EMA) crossed back above the slow moving average (30 SMA). And again, this signal was generated when the market broke back above the early December highs of 126.26. For those that missed the initial signal, look to buy half your position now and use any pullbacks to add to the position. I do see a rather noticeable gap at 125.50 that was left just a couple weeks ago. My hunch would be that that gap will be filled at some point in the not too distant future. With the move though 128.60 just this week, we now have a rather large upside target of 138.32 [Bull flag formation: (128.6-106.75)+120.03 = 115.47]. Yes this number does seem a bit extreme, but as we head into the typical seasonal peak of late spring, I wouldn't be surprised to see that number hit. And as Don suggests, Sell those stocks when that snow melts!!!

That's all for this week,
Brian Beamish FCSI
The Canadian Rational Investor