Our regular weekly peak at the SPY (S&P 500 depository trust units):

With my personal activity focused on the very difficult notion of day trading the Crude Oil markets I must admit I have let some of my other free blog services slide of late. Having said that, the best part of using a very slow timing signal (like our weekly 13ema/30sma cross system) is that once a trend is established, it can often go on for far longer than any of us would expect. Indeed that does seem to be the case with the US stock market in general and the S&P 500 stock index in particular.
The current price action seen in stocks globally reminds me of the old cliche of 'climbing the proverbial wall of worry' in that the average investor panicked into the financial crisis and dumped their long positions. They will continue to be bearish as price moves back up and claim that 'fundamentals don't justify prices rising'. Ironically, it is at the point where the average investor capitulates (and buys back their positions) that we as 'smart traders' need to start to get worried. As long as I turn on CNBC or Bloomberg TV or any or the other major media outlets and they are talking bearishly then I am more than happy to stay long. Once they start to get bullish, then I will start to get concerned.
Our last trade (investor 'buy') signal was generated way back in the fall of 2011 (at or near the 120 level on SPY) when the weekly 13ema crossed back above the weekly 30sma. The market has rallied more than 20 points from that level and investors are still cautioned to remain long as that moving average relationship is still pointing rather bullishly. Considering dividends, this one trade about a year ago has turned out to be very profitable.
Given the dramatic rise in stock valuations over the past year investors should not be surprised if we do indeed have to go through a short term correctionary period in the not too distant future. Our other time tested trading tool (the 50% rule) suggests this market at any given point in time could be subject to a 10% correction. As well, I do believe there is significant support at or near the original breakout point (125 area) and that is indeed about 10% lower than where we currently are. I say correction because there is little evidence to support the notion that this bull is finished.
Fundamentally, corporate earnings (while not gangbusters) are 'ok'. Additionally, the yield curve is currently in a normal or healthy state (ie short term interest rates are lower than long term interest rates). Seasonally, we are entering an 'ok' time of year for stocks too (once out of October markets very rarely crash until into the new year) and finally, we have a pending election to deal with. Put all this together and it is my assumption that prices may 'correct' over the coming weeks but that correction is a buying opportunity.
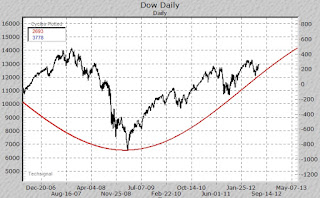
As an added bonus this post, I have included a chart from the good people at the Foundation for the Study of Cycles (webiste). The chart is an actual price action chart of the Dow overlaid against their current cycle projections. While the chart in itself isn't enough to base an investment decisions, it is interesting how it seems to correlate with the notion that we ought to see higher not lower stock prices over the coming weeks/months.
Trader Stance: With the recent daily/4hour double top coming in on SPY traders ought to be looking closely at the weekly 13ema for short term direction. If the market fails then a short trade back to the 30sma seems likely and if that push has any enthusiasm we may see the daily 50% level hit. Traders ought to be focused on OTE ss entries with tight stops just above resistance.
Investors Stance: This camp has been well advised to be long and stay long for almost a year now. Those that took last year's investor 'buy' signal are well into double digets returns (if not more) considering dividends. As long as the 13ema remains above the 30sma I see no reason to touch long positions at the moment. Be long and stay long as we collectively climb the 'wall of worry'.
That's all for this week,
Brian Beamish FCSI
The Canadian Rational Investor
the_rational_investor@yahoo.com
http://www.therationalinvestor.ca/RI_Tradents.php#sp500bloglink
http://www.therationalinvestor.ca/RI_Tradents.php#sp500bloglink