Hi there, and welcome back to CRI's S&P 500 blog.
For the past eight weeks we have seen the broader US stock market flounder as it comes to grips with the notion that the US Fed will stop flooding the market with cash. The end of QE2 has been met with a literal stop to any and all new purchasers. Last week's blog entry suggested that the market needed to rally a bit to relieve its oversold condition and that the 130 area seemed like a reasonable target. Indeed, as the market headed into the 2 day FOMC meeting (held last Monday to Wednesday) the 'dead-cat bounce' was fully underway and the market did rally into the suggested target zone. Upon the completion of the meeting (and more importantly the announcement of no new QE3 program) the market topped and then failed miserably into the weekend. So what can both traders and investors take away from this past week's price action?
Traders: Since the 'outside-downside' bearish price pattern registered just three weeks ago, traders have been well advised to be flat and watching from the sidelines. Considering the steep sell-off, I still wouldn't be surprised to see a bit more of a rally before one considers going short aggressively. So, as was the case last week, traders ought to be sitting in cash and watching.
Investors: Here we have a potential event that warrants attention. Since last fall's breakout, investors have been well advised to be long (and stay long). The market slowly worked it's way higher as our time tested 'investor signal' (that being the relationship between the 13 EMA and the 30 SMA) had been comfortably bullish. That may be about to change. On the failure last week, the 13 EMA is just a fraction above the 30 SMA and unless there is some sort of explosive rally coming, that relationship will turn negative for the first time in six months. While I am reticent of jumping out too soon, investors would be well advised to pay close attention to this important relationship and more importantly - for a change.
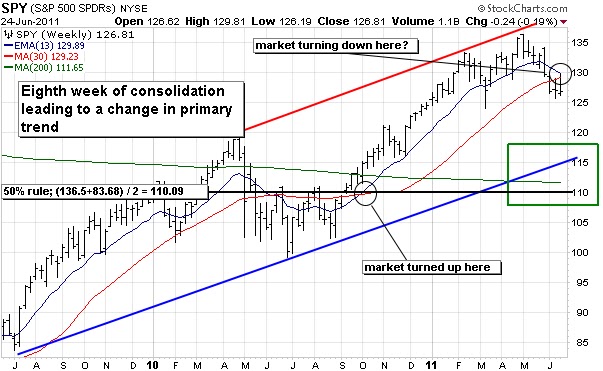
So if the market continues to consolidate, where might we be heading? As the chart above suggests, there is a lot of evidence to support the notion that the market would like to work its way back down into the 110-115 area. Three technical indicators suggest such an event. 1. The 200 SMA is sitting at 111.65. 2. A 50% rule of the entire bull move (from June 2009 to now) suggests prices want to come back to 110.09. 3. The bottom of the very well defined price channel sits in and around the 115 area.
Ironically, this target zone is within a fraction of where it broke out last fall, suggesting that the last six months of rally was for nothing. Additionally, any new QE3 program will only be initiated when the market is looking to be heading into free-fall. I might suggest that these two events will coincide - When the market makes its final push into the target zone - macro-economic will force QE3 and the market will stabilize once again....but that is just a theory for now.
That's all for this week,
Brian Beamish FCSI
The Canadian Rational Investor
the_rational_investor@yahoo.com
the-rational-investor.com
No comments:
Post a Comment